The role calibrated imagery plays in your fertility ROI Using dirty data when trying to…
Not All NDVI Values are Created Equal
Active Versus Passive NDVI – the Difference is in the Data
Bad data = bad everything. Let’s use building a house as an analogy. If we build the foundation before prepping the soil, we will eventually have a domino effect of problems. The foundation will eventually break, leading to cracks in the walls and an unsound, unreliable structure that compromises the quality of your home, its economic value and leads to more money spent to fix the issues created from not taking the time to prep for a good, solid foundation. The same can be applied to precision agriculture data. If we build things off data, we must have reliable information to build upon, so we don’t compromise quality at the expense of something else that may not lead to an economical return.
At the highest level, there are two distinct data groups: quantitative and qualitative data.
Quantitative data is measurable, it’s more absolute. It deals with numbers and things you can measure objectively. When you measure something and give it a numeric value, you’re using quantitative data.
Qualitative data is characteristics and descriptors that can’t be measured but can be observed subjectively – such as characteristics, interpretations, etc. When things are classified or judged, you’re using qualitative data.
Passive and active normalized difference vegetation index (NDVI) fall into these two categories. When using NDVI for fertility management, one is better than the other and gives you and your growers greater value and better return on investment (ROI).
WHAT IS NDVI
NDVI is a simple indicator of photosynthetically active biomass. Since agronomists and scientists began using it in 1973, NDVI has become one of the best known, most successful and most widely used vegetation indices for characterizing and monitoring crops. NDVI can be used for various crop management problems and it provides several economic benefits.
NDVI is correlated with:
- Plant biomass
- Crop yield (biomass is related to yield)
- Plant nitrogen content
- Plant chlorophyll
- Water stress
- Plant diseases
- Insect damage
NDVI has many agronomic uses and economic benefits. You can use NDVI to calculate and track the following crop management practices or problems:
- Identify yield zones and/or management zones
- Early diseased areas detection
- Variable rate applications (VRA)
- Yield modeling
- Early water stress detection
- Detect damaged areas due to extreme weather
- Detect weeds
- General scouting
- Guide soil and tissue collection
- And more …
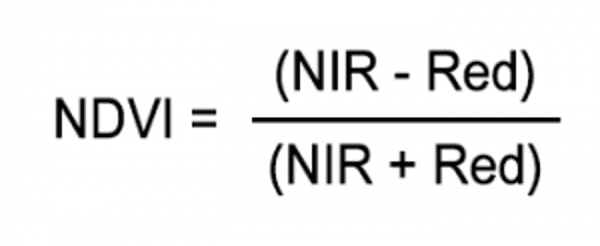
HOW NDVI IS CALCULATED
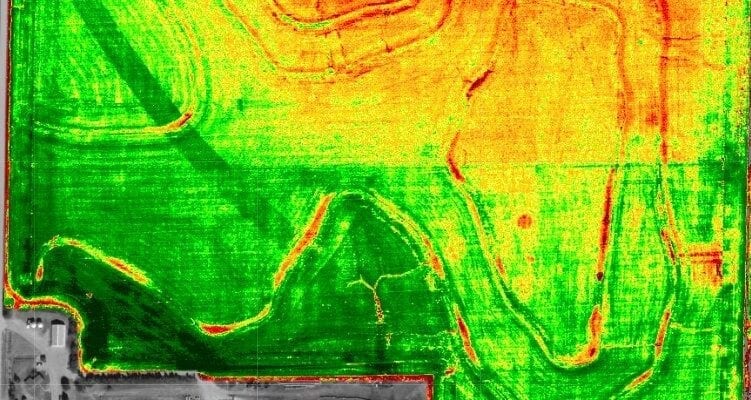
NDVI is a mathematical function of two wavelength regions’ reflectance values, near-infrared (NIR) and visible (commonly red). It quantifies vegetation health by measuring the difference between near-infrared (which vegetation strongly reflects) and red light (which vegetation absorbs). Healthy vegetation absorbs most of the visible light that hits it and reflects a large portion of the near-infrared light. Unhealthy or sparse vegetation reflects more visible light and less near-infrared light.
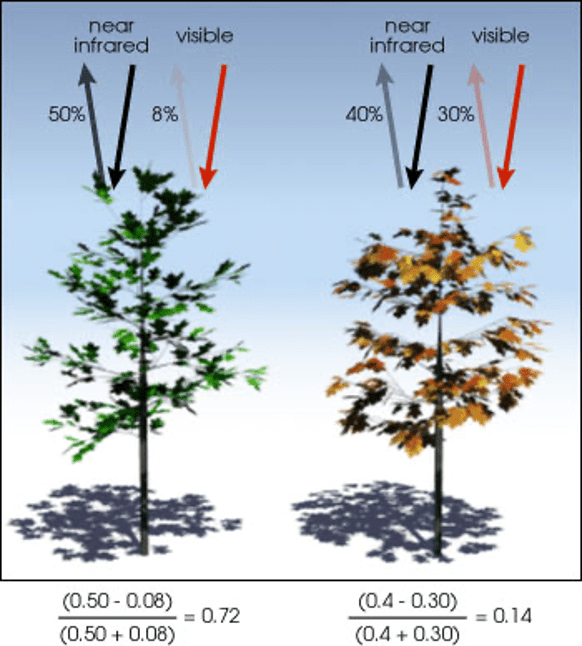
Overall, NDVI is a standardized way to measure healthy vegetation. When you have high NDVI values, you have healthier vegetation. Lower NDVI values mean you have unhealthy or less/no vegetation.
ACTIVE VS. PASSIVE NDVI – THE DIFFERENCE IS IN THE DATA
Some of you may have heard the W. Edwards Deming quote, “Without data, you’re just another person with an opinion.”
Edwards, an engineer, statistician, professor, author, lecturer, and management consultant was described as the high prophet for quality control and worked as a mathematical physicist for the U.S. Department of Agriculture in 1938. In a nutshell, he was best known for using quality data to make impactful, positive change.
When comparing active and passive NDVI, it all comes down to data quality. Active NDVI is your quantitative data (your absolute, measurable data). Passive NDVI is your qualitative data (your interpretation or educated guess). Active NDVI delivers better data quality over passive NDVI.
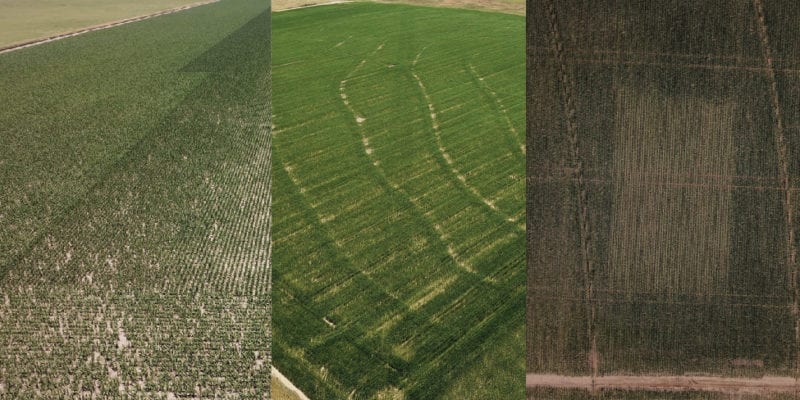
Passive NDVI data is imagery collected from the sky using satellites, planes and drones. Passive sensors use naturally occurring energy, such as the sun, to measure reflected energy from the target. Reflectance is passed from the sun to the Earth and back to the passive sensor, making electromagnetic energy pass through the atmosphere twice.

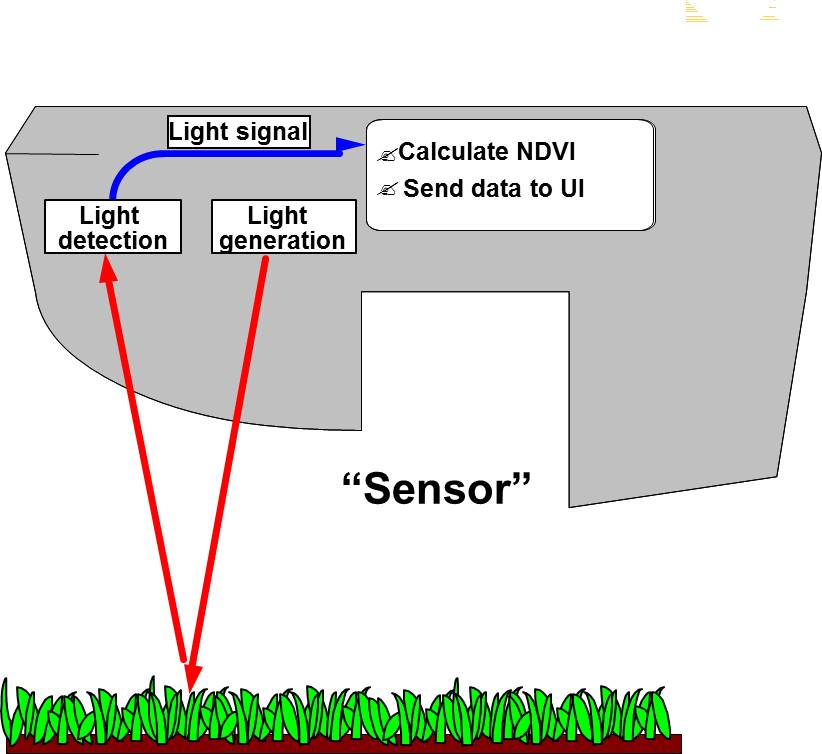
Active NDVI is collected using handheld sensors, such as Trimble’s GreenSeeker or Holland’s Crop Circle. Active sensors, on the other hand, provide its own energy source for illumination and measures reflected energy directly from the crop canopy. Since active sensors directly measure its target, NDVI values are repeatable over time and space, making data more absolute and reliable. By using active NDVI, you are employing data quality control.
The kicker is, depending on your goal, you should be cautious about what type of NDVI data you use. Passive NDVI data will not result in a high economic benefit if you are using it for something that requires more absolute, or quantitative, data. If you want to use NDVI for recommendations or yield modeling, then you need something that delivers active NDVI data, your quantitative data. If you use passive NDVI data for these two things, you are using problematic data that is not giving you the best, most economical result.

THE CHALLENGE WITH PASSIVE NDVI
The problem with passive NDVI imagery is there is no universal scale system. Results are problematic when imagery data are used in its raw format to conduct analyses that require absolute data, such as recommendations and yield modeling.
With no universal scale system, passive NDVI may not always be NDVI. Some providers may alter color and values to fit historical data and maintain the appearance of consistency between different seasons and camera systems. This combined with the lack of ground-truthing means it is not quantitative, repeatable data. It’s not absolute. For example, you could have lost a field to a weather event. You know the field is gone. However, the imagery source’s systematic alterations could tell you a different story and indicate most of the field is healthy even though you know it’s not true. Would you want to use this data as your recommendation foundation?
Another issue is passive sensors use naturally occurring energy for NDVI data collection, so data isn’t the same across time and space. Time of day, cloud cover, sun angle, etc., directly impacts reflectance measurements, which makes NDVI values inconsistent and unreliable for practices that require absolute data. For example, if you get two images of the same field in one day, values could be significantly different due to atmospheric interferences. Though the crop didn’t change in-between the two times you collected imagery, the difference impacts your applications and yield potential data.
Passive NDVI has its uses and economic value for crop management practices. It’s a useful tool for streamlining scouting, identifying problem areas due to pest or disease issues, guiding soil and plant tissue collection, creating management zones, and monitoring irrigation and drainage. However, calibration is necessary if you want to use it for more than scouting and detecting issues.
WHY PASSIVE NDVI CALIBRATION IS NECESSARY
Imagery is like a soil test – it’s up to the owner’s interpretation. Many imagery issues are not easy to detect with the human eye, which makes it problematic and leaves room for error. You’ve got to have a goal in mind when using imagery. If you want to use it for fertility recommendations and yield modeling, then calibration is necessary.
Calibration is a method that corrects atmospheric disturbances. Since energy is passed through the atmosphere twice when using passive NDVI, atmospheric disturbances occur, such as absorption and scattering. Absorption reduces intensity with a haziness effect. Scattering redirects energy in the atmosphere causing an adjacent effect when neighboring pixels are shared. Absorption and scattering negatively affect image quality and NDVI values and are the main reasons atmospheric correction is needed.
Passive NDVI has its challenges since providers may alter imagery color and values. If your goals require reliable, repeatable data, then calibration is needed on all imagery sources. Calibration provides users with absolute, actionable data that’s a true representation of the field and not an interpretation.
Many atmospheric factors can impact the digital signal or reflectance of the plant canopy, so calibration is critical to reliably visualize, diagnose and compare data over time and space. NDVI that’s not measurable impacts your fertility recommendation outcomes. Without calibration, quantitative measurements are directly impacted, which affects quality and grower ROI.
WHY USE ACTIVE NDVI
Active sensors screen out natural light to remove atmospheric disturbances and are not affected by light conditions (cloudy vs. clear skies, etc.), so calibration is not required. Advantages for active sensors include the ability to obtain measurements anytime, regardless of the time of day or season.
Active sensors examine wavelengths that are not adequately provided by the sun to better control the way a target is illuminated. As a result, you get more reliable, absolute data that’s the same across time and space that gives you more precise and economical recommendations and yield models.
Problems and crop management strategies that require a field to have multiple images throughout the season can benefit from active NDVI. By not using active NDVI, you’re using interpreted data to make decisions that require quality, measurable data.
Without data, you’re just another person with an opinion. – W. Edwards Deming
THE NINJA WAY
Imagery has economic value, but you must have a goal in mind to maximize that value. To maximize your imagery’s economic value, you must calibrate your imagery if you want to use it for:
- Research
- Monitor a field over time
- Build reliable yield models
- Create more precise fertility recommendations
Deming also said, “Quality is everyone’s responsibility.” Calibrated imagery sets a reliable foundation that ensures you use quality data to build impactful, economical recommendations and yield potential models.
Ninja Ag makes this process easy by using active sensor values to calibrate all passive NDVI sources. We use the calibrated image and research-proven, custom algorithms and models to produce VRA recommendations, yield potential maps and ROI maps. Within minutes, you have information based on absolute data and not someone’s educated guess. Our system is your quality data check and helps you use better data for better decisions, better precision and better results.
We have VRA options for several different row crops and can customize algorithms for specialty crops. Algorithms can be customized to your geographic environment. Contact, Tyler Lynch, our agronomist and account manager at tlynch@ninjaag.com today and learn how you can get started with us this season.
SOURCES
Iowa Soybean Association: Digital Imagery Technologies Aid in Crop Management
Iowa Soybean Association: Quality of Digital Aerial Imagery and Implications for Various Uses in Agriculture
Down and Dirty with NPK: NDVI, it’s not all the same.
GIS Geography: What is NDVI?
GIS Geography: What is atmospheric correction in remote sensing?
Related Posts