Helping Growers Adopt New Technologies that Optimize Return on Investment Getting growers onboard with new…
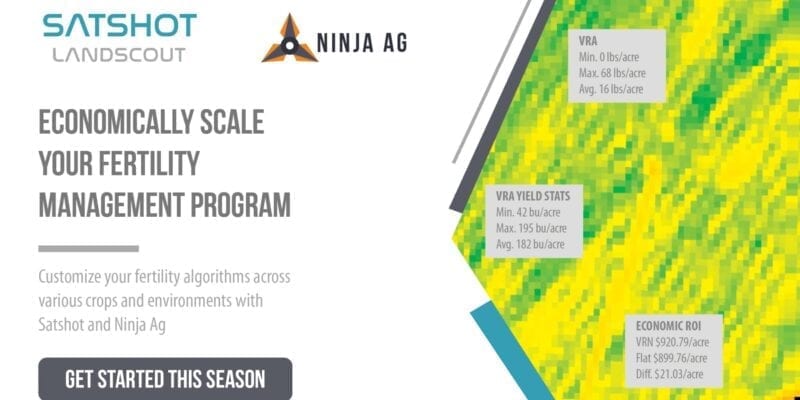
The Difference is in the Data
The role calibrated imagery plays in your fertility ROI
Using dirty data when trying to achieve optimum yield levels and maximum return on investment is like throwing a bunch of money into the wind. Imagine, standing in the middle of your field and taking fist fulls of $100 bills and throwing them in 20 mph winds. You don’t know where that money will end up. You may be able to chase down and recover some of your money but likely most of that money will either never be seen again or end up in someone else’s hands. This is the impact of dirty data when using it to apply nitrogen. You’re literally throwing away money.
I don’t know about you, but living in central Oklahoma, 20 mph winds is a generous wind day. It’s not uncommon to see 30-40 mph winds. Imagine the devastation of using that type of wrecking ball data to make nitrogen application decisions. It’s risky business. With a lot of uncertainty in precision agriculture, adding unnecessary risk will cost you. You may not know how much it’s costing you, but it’s costing you something. If you’re using uncalibrated imagery to create nitrogen recommendations, then you’re running a risky business.
CALIBRATED VERSUS UNCALIBRATED IMAGERY
Uncalibrated imagery has inconsistent values and invalid, inaccurate data. It’s an incomplete dataset. It may not accurately represent your field’s current health. The data isn’t the same across time and space, so it’s left up to someone’s interpretation of it to make decisions, which is why it’s been mostly used to detect potential field issues and scouting. It’s unreliable for anything else.
Calibrated imagery has been corrected to adhere to data quality standards. The data is the same across time and space. Meaning you could use different data sources and collect multiple images in the same day on a field and the data will be the same and an accurate representation of field health. It’s a reliable, accurate and complete dataset that can be used to make data-driven decisions.
WHY DATA QUALITY IS IMPORTANT
If you’re using imagery to create nitrogen recommendations, then data quality standards must be met. Data quality measures how well a dataset meets criteria for accuracy, completeness, validity, consistency, uniqueness, timeliness, and fitness for purpose. It is critical to all data governance initiatives within a business and farming operation. Data quality standards ensure you make data-driven decisions that meet your goals. If data issues, such as duplicate data, missing values and outliers aren’t properly addressed, then you increase your risk for negative outcomes – it’s like throwing money into the wind. Using uncalibrated imagery data to create a nitrogen recommendation will cost you.
When imagery data quality meets the standard for its intended use, you can trust the data and leverage it to improve decision-making, leading to the development of new business strategies or optimization of existing ones. You’re putting your money in the bank, not in the wind.
Data quality isn’t only a priority for day-to-day business operations – it’s crucial. As companies integrate artificial intelligence (AI) and automation technologies into their workflows, high-quality data will be crucial for the effective adoption of these tools. As the old saying goes, “garbage in, garbage out,” and this holds true for machine learning algorithms as well. If the algorithm is learning to predict or classify on bad data, we can expect that it will yield inaccurate results.
WHAT’S THE DIFFERENCE: CALIBRATED VERSUS UNCALIBRATED
The difference is economic and environmental impact. Uncalibrated imagery isn’t purposed for nitrogen recommendations and scientific modeling. That’s a job for calibrated imagery. The difference is the data, but service providers and farmers will see the difference in their pocketbook. The problem is, since uncalibrated imagery consists of inaccurate data, you won’t know how much money you’re throwing away on unnecessary inputs, or how much money you’re leaving on the table due to not maximizing yield. Using uncalibrated imagery long-term for data-driven decisions will negatively impact farm sustainability. It will also potentially introduce unnecessary nitrogen into the environment due to over application or putting fertilizer where it’s not needed. Dirty data = dirty consequences.
DIRTY DATA, DIRTY CONSEQUENCES
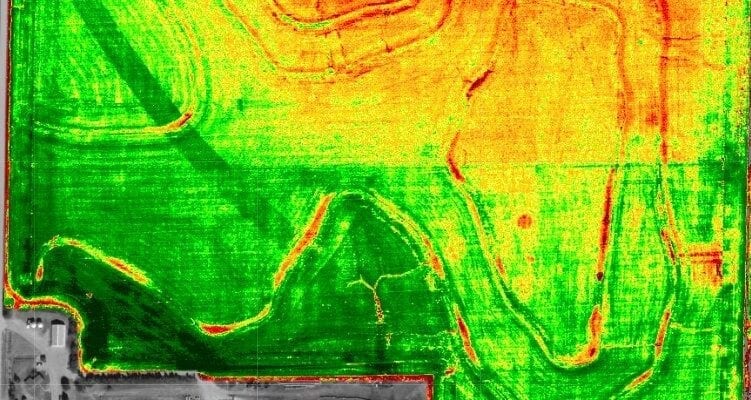
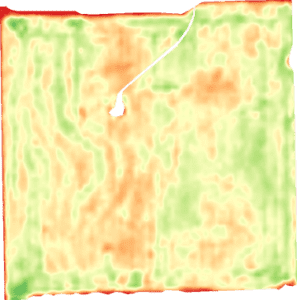
High-Resolution Drone Imagery
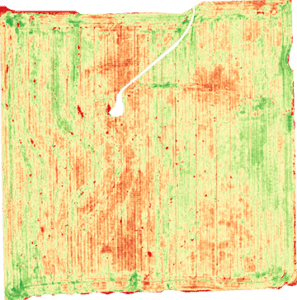
Above (left) is an uncalibrated drone image of wheat field. On the right, is an image calibrated by Ninja Ag’s system. The colors on the uncalibrated drone image tell us the NDVI range is compressed – it’s telling us the good areas aren’t as good, and the bad areas aren’t as bad. The difference in these NDVI data values could significantly impact a grower’s bottom line. In this case, the grower would have lost money by under applying nitrogen by an average of 21 lbs. per acre. They would have lost about 9 bushels/acre. The total loss for this field would have been approximately $9,720 for not meeting optimum yield. Even if you’re using this imagery to provide a zone-based recommendation, you’re still going to be off by at least 21 lbs. or more.
Modern Satellite Imagery
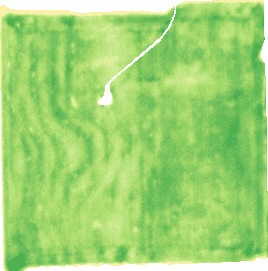
Above (left) is an uncalibrated image from a modern satellite provider. This satellite provider delivers 6-foot imagery resolution. In comparison to the calibrated image from Ninja Ag’s system (right) and the drone image, it’s easy to see in the uncalibrated image NDVI values were shifted up – making the field appear much healthier than it is. Ninja Ag’s calibrated image corrected this issue, making data more reliable. In Ninja Ag’s calibrated image, it’s also easier to see field variability. If you were using the uncalibrated image for nitrogen recommendations, you would have lost money on this field by under applying nitrogen. Since NDVI values were elevated and did not properly communicate field health, full yield potential would not have been met. Using the uncalibrated image over Ninja Ag’s system, the grower would have under-applied an average of 32 lbs. per acre. They would have lost about 12 bushels/acre. The total loss for this field would have been approximately $12,960 for not meeting optimum yield.
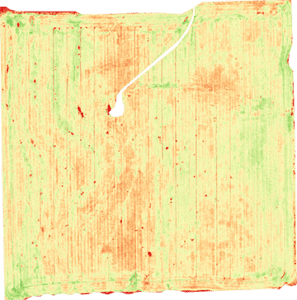
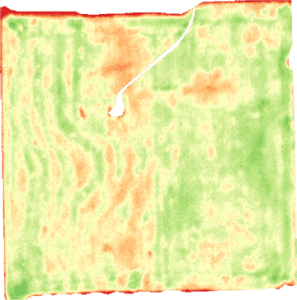
Low Resolution Satellite Imagery
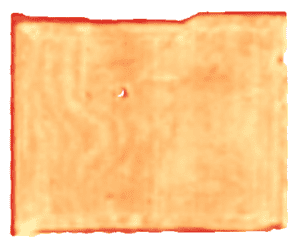
Above (left) is a lower resolution satellite image. This is 15–30-foot resolution imagery. In the uncalibrated image, it’s easy to see the NDVI values are lower. Ninja Ag’s calibration brought NDVI values up to reality. Using the uncalibrated image for any data-driven decision would be extremely costly. In this particular image, it would result in significant under application. It would be extremely difficult to nail down an appropriate fertilizer application range using these extremely low and unrealistic NDVI values. On average, using the uncalibrated image for nitrogen recommendations over Ninja Ag’s system would have resulted in an under application of 53 lbs. per acre – resulting in a loss of about 26 bushels/acre. The total loss for this field would have been approximately $28,080 for not meeting optimum yield.
IMAGERY SUMMARY
When standing all three of Ninja Ag’s calibrated images up side-by-side, it’s easy to see the consistency visually and in the data. The only difference is the resolution. The maps and NDVI values are the same. In drastic contrast, if you compare the different sources, the imagery is telling a different story in each image. The data is inconsistent and unreliable. Ninja Ag makes imagery data more reliable. You could use multiple imagery sources on a field the same day, as we’ve shown, and get drastically different data and maps. Ninja Ag makes imagery the same across time and space – no matter the source and time of day.
HOW YOU CAN ENSURE DATA QUALITY
What you can do to ensure data quality standards are met if you plan to use imagery for recommendations:
- Set goals: Set overall fertility management goals. If you don’t identify goals, then it’s hard to understand how a company’s products and services are serving you well. Ask questions and thoroughly vet the company to ensure it will help you meet your goals. If quality is a standard you set, then ensure you apply quality across the board in all your operations, and don’t cut corners. Quality isn’t about cutting corners; it’s about optimizing results.
- Create data quality standards: Ensure you set a data quality standard, so you have a measuring stick that ensures you choose providers and technologies that support your goals. If companies don’t meet your standards, then you know you need to keep looking for like-minded companies to do business with. Remember, there’s a cost for lowering your standards.
- Ask for data quality measures: If your nitrogen recommendation provider uses imagery it’s important to understand how that imagery is used and know if the imagery calibrated. Any company that values quality data will have data quality dimensions defined and will be able to easily communicate how they are doing this. If they can’t quickly and transparently provide this information, then it’s a red flag.
THE NINJA WAY
Ninja Ag was created as a result of the industry needing quality imagery data to create more precise fertility recommendations and to mitigate the negative impacts associated with using poor imagery data. Our models were developed by researchers using calibrated NDVI data. Ninja Ag allows you to use any imagery source to get the same research-quality data and results.
If you want to employ data quality measures in your fertility management plan this season, then contact us. To ensure quality data is achieved, we require you have the following:
- Reference strip in each field
- Trimble’s handheld GreenSeeker sensor
- Imagery: We can process all imagery sources. While others may be calibrated to one source, our system gives you flexibility to work with all providers and not worry about the outcome.
To learn more or to request a Ninja Ag demo, email info@ninjaag.com.
Related Posts